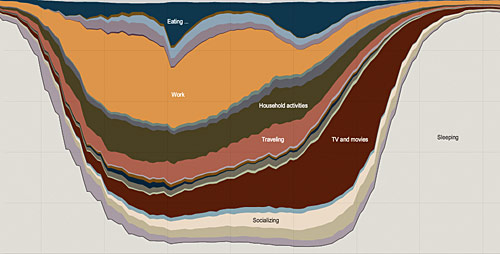
The New York Times last week released an awesome, and I do mean awesome, interactive graph of how people spend their day. You can break-down the graph by group (e.g. men, women, age, etc.) and isolate specific activities (e.g. work, sleep, computer use, etc.). I learned that at 11:10pm, 1% of Americans are using their computer and 66% are sleeping. I’m about to join the latter.

(Nod: Lifehacker)